The GSC Performance report shows four core metrics — clicks, impressions, CTR, and average position — for every query and page Google has data for. Filter by Search Type: Web, use date comparison to spot trends, and segment by query, page, country, or device. It is the only source for actual click and impression data directly from Google — no third-party tool replicates it.
Introduction
Most SEO teams open the GSC Performance report, glance at total clicks, and close the tab. That’s a missed opportunity.
The GSC Performance report is where Google tells you exactly which queries trigger your pages, which pages earn clicks, and where the gap between visibility and traffic is widest. No third-party tool can replicate this GSC data — Semrush and Ahrefs estimate impressions; GSC reports them directly from Google’s index.
In 2026, with AI Overviews compressing CTR on informational queries and a native branded filter now available inside the report, reading GSC Performance data correctly is more valuable — and more nuanced — than it’s ever been. This guide covers every metric, filter, and workflow you need.
Key Takeaways
- The Performance report tracks four metrics: clicks, impressions, CTR, and average position — each measuring a different stage of search visibility.
- Always set Search Type to Web before any analysis — the default view blends image, video, and Discover traffic with organic search data.
- The Compare date function is the fastest way to spot content decay, ranking drops, and the impact of any on-page change.
- GSC data is retained for 16 months — export regularly to BigQuery or Looker Studio before the window closes.
- As of February 2026, the AI-powered configuration tool lets you set filters and date comparisons using plain-language prompts directly in the report.
What the GSC Performance Report Actually Measures
The Performance report tracks how your site appears and performs in Google Search results. It does not track Bing, social, or paid traffic — only Google organic.
There are four core metrics in the GSC data:
| Metric | What It Measures | When It’s the Priority |
|---|---|---|
| Clicks | The number of times a user clicked your result in Google | Traffic volume — your bottom-line organic number |
| Impressions | Times your URL loaded in a search results page | Visibility — high impressions with low clicks = CTR problem |
| CTR | Clicks ÷ Impressions | Snippet effectiveness — title and meta description quality |
| Avg. Position | Mean ranking position across all impressions | Ranking health — aim to reduce this number over time |
Key nuance on average position: it’s a mean across all impressions for a query. If your page ranks #1 for desktop and #15 for mobile, the blended average may show position 8. Filter by device for accurate position data before making any ranking decisions.
Clicks are the most reliable metric in GSC data. Impressions were temporarily inflated by automated bot scrapers using the &num=100 parameter until Google disabled it in late 2025. Any year-over-year impression comparison crossing that boundary needs to account for the recalibration.
To get a complete performance picture, you should complement your GSC data with post-click behavior insights—this is where a deeper GSC vs GA4 comparison guide becomes critical for understanding how users actually engage after landing on your site via Google Search Console and Google Analytics 4.
How to Set Up the GSC Performance Report Correctly
The default report view is not clean enough for SEO analysis. Three setup steps are required before any meaningful work begins.

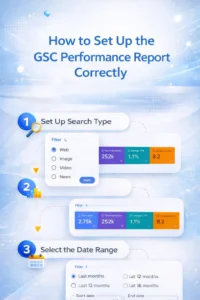
- Set Search Type to Web. The default blends Image, Video, News, and Discover traffic alongside organic web results. Each has different CTR benchmarks and query intent. Mixing them distorts every metric.
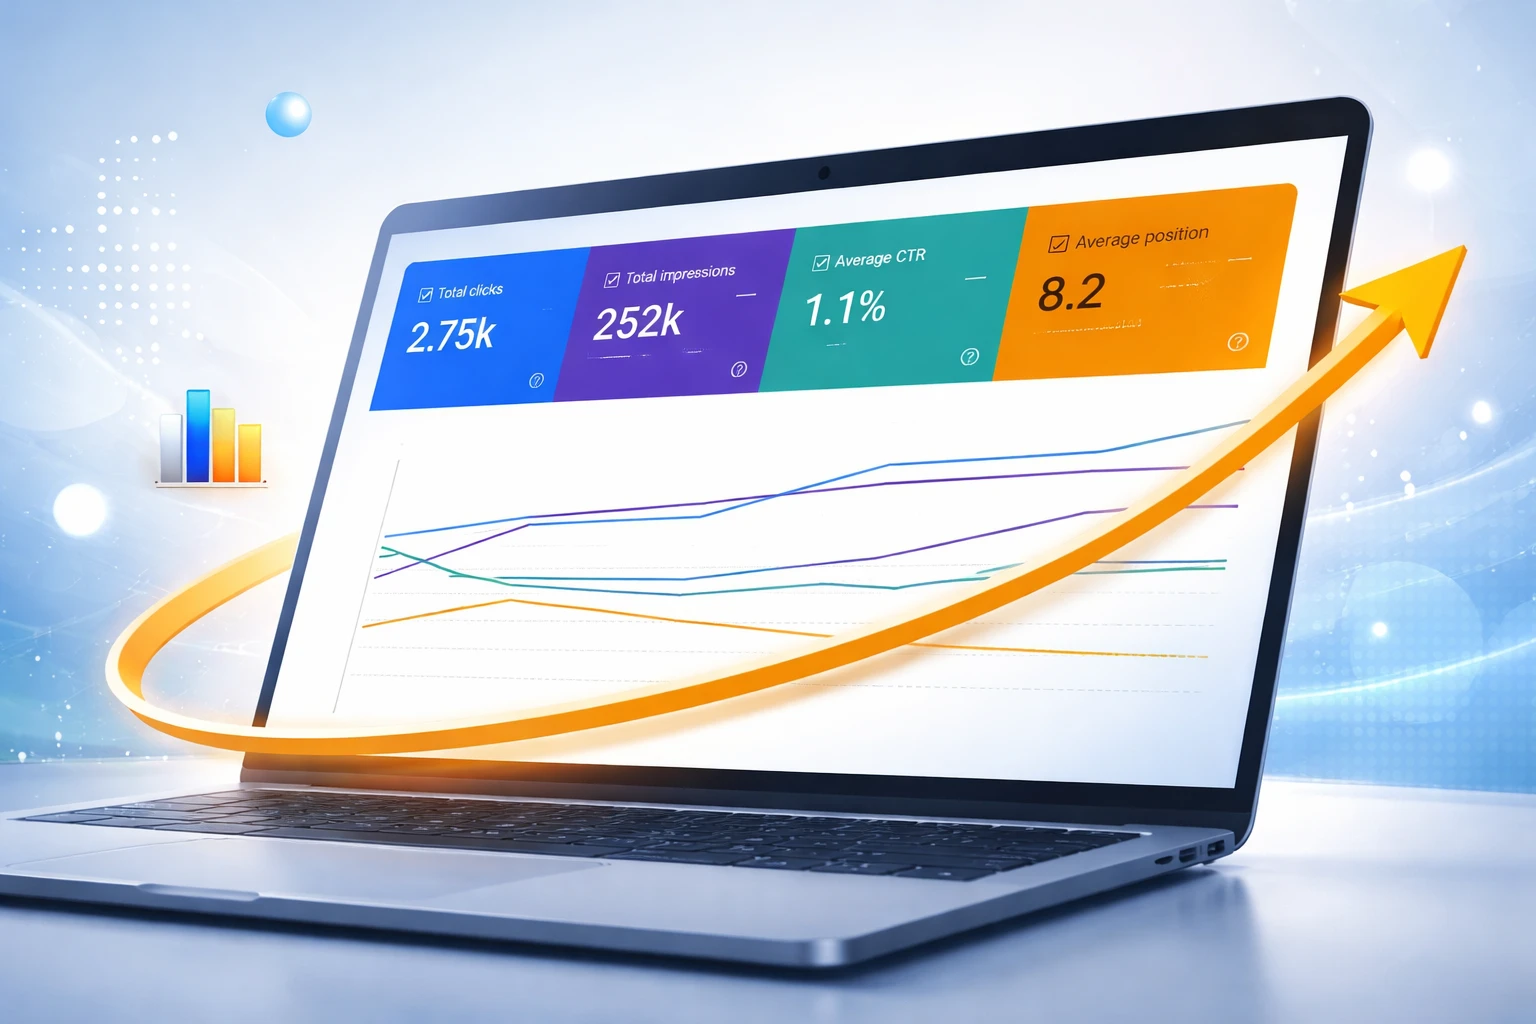
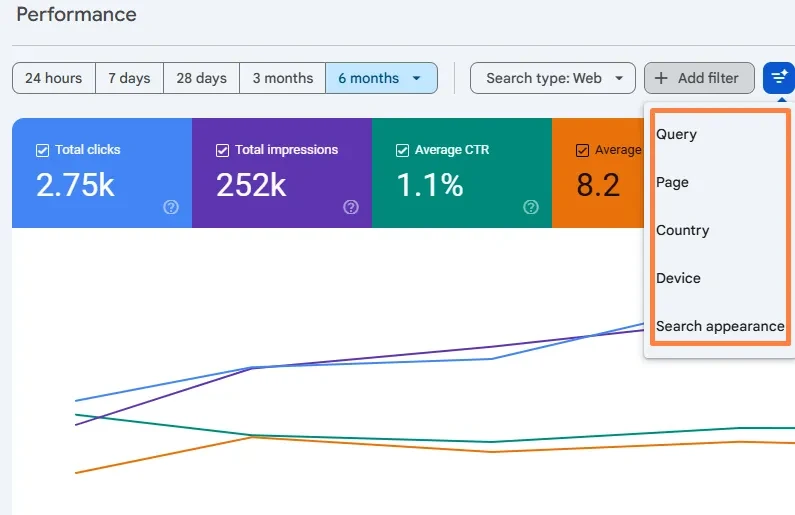
- Enable all four metrics. Click each of the four metric tabs — Clicks, Impressions, CTR, Average position — so all appear in the chart simultaneously.
- Set the date range. The default is the last three months. For most analysis, 28 days provides enough data without seasonal noise. For trend analysis, use the Compare function (last 3 months vs. previous 3 months).
If pages aren’t appearing in the Performance report, they may not be indexed — a common issue covered in this pages not indexed by Google guide within Google Search Console.
As of February 2026, the GSC Performance report includes an AI configuration tool. Type a plain-language prompt — for example, ‘show non-branded queries for mobile in the last 28 days’ — and the report automatically applies the correct filters.
Always verify the filter chips applied before concluding. The AI configures the report — it does not analyze it. Sorting and exporting still require manual action or the Search Analytics API.
The Five Most Useful Filters in the GSC Performance Report
Filters transform the Performance report from a summary dashboard into a diagnostic tool. These five are the highest-leverage.

| Filter | How to Apply It | What It Diagnoses |
|---|---|---|
| Query — Branded vs Non-Branded | Use the native Branded filter (Nov 2025) or regex | Separates brand traffic from SEO performance |
| Page — Specific URL | Click a page in the Pages tab to drill into its queries | Which queries drive a single landing page |
| Device — Mobile vs Desktop | Add Device filter, compare Mobile vs Desktop side by side | Mobile/desktop CTR gaps — often a truncation issue |
| Country | Add a Country filter for each target market | Market-specific CTR or ranking gaps |
| Search Appearance | Filter by Rich Results, Discover, Web | Whether schema markup is generating incremental clicks |
The Search Appearance filter is the most underused in the report. It isolates clicks from FAQ rich results, review stars, HowTo carousels, and sitelinks — separately from standard blue-link results. If you’re running structured data and not using this filter, you have no way to know whether your schema is producing real traffic.
How to Use GSC Data to Find Real Opportunities
Raw GSC data has three high-value use cases beyond checking total clicks. Each requires a specific filter combination.
1. Striking Distance Keywords
Queries ranking at positions 5–15 with reasonable impressions have the highest ROI for content optimization. A single title tag or content improvement can move position 8 to position 3 and multiply clicks by 3–5x.
Filter setup:
- Pages tab → click any page → Queries tab
- Enable Average Position metric
- Sort by Position ascending — look for queries between 5–15
- Cross-check CTR: if position 8 is showing under 3% CTR, there’s a packaging problem too
2. Content Decay Detection
Content decay is the gradual loss of clicks on older pages — invisible without date comparison.
Filter setup:
- Date filter → Compare → Last 3 months vs Previous 3 months
- Pages tab → sort by Clicks Difference (descending)
- Pages losing 20%+ clicks in 3 months are showing decay signals
- Click each declining page → Queries tab — if all queries are declining, the page has a content freshness problem; if one query is declining, a specific ranking dropped
3. CTR Leaks
Pages with high impressions and low CTR are ranking but not earning the click — a title or meta description problem, not a rankings problem.
Filter setup:
- Queries tab → enable CTR and Position metrics
- Filter: Position less than 10, CTR less than 3%
These queries are the highest-impact title optimization targets — ranking already achieved, only the packaging needs to improve. To execute this effectively, you need to how to improve CTR using GSC by leveraging query-level insights from Google Search Console to refine titles and meta descriptions based on actual search behavior.
The Compare Function: The Most Underused GSC Feature
- Click the date filter → Compare → select two equal-length periods
- In the chart, lines that diverge after a specific date confirm that a change had an impact
- In the table, the Clicks Difference and Position Difference columns show per-page and per-query change
- Sort by Clicks Difference descending to find winners; ascending to find losers
After changing a title tag, wait 28 days. In the Performance report, filter by that page URL. Use Compare: the 28 days post-change vs the 28 days before. Check CTR at the same average position. A CTR improvement at an unchanged position is the metadata’s contribution — isolated from any ranking change. This is the correct measurement method, not comparing total traffic.
GSC Data Retention and Export
The Performance report stores data for exactly 16 months. For year-over-year analysis — a standard SEO comparison — data from 13+ months ago starts disappearing. Two options:
- BigQuery export: Connect GSC to BigQuery via the Search Console API. Data is exported daily and stored indefinitely. Required for query-level analysis at scale.
- Looker Studio: Connect GSC as a data source and schedule automated refreshes. Lower technical barrier than BigQuery. Suitable for most teams without a data warehouse.
Both options also bypass the 1,000-row UI limit in the Performance report — the API returns complete data for all queries and pages, not just the top 1,000.
Conclusion
The GSC Performance report is where Google’s view of your site becomes readable. Clicks, impressions, CTR, and average position — filtered correctly and compared over time — answer the three questions that drive every SEO decision: what’s ranking, what’s earning clicks, and what changed.
The teams getting the most from this GSC data aren’t just checking total clicks weekly. They’re using the Compare function to validate changes, the Search Appearance filter to measure schema ROI, and the striking distance workflow to find the highest-return optimization targets on the site. Combined with a GA4 connection for post-click behavior, the Performance report becomes the foundation of a complete organic search analytics stack.
Set Search Type to Web. Enable all four metrics. Export to BigQuery or Looker Studio before the 16-month window closes. That’s the setup. Everything else in this guide is the workflow built on top of it — especially when you combine Performance data with structured workflows from a GSC opportunities guide to systematically identify and act on growth levers within Google Search Console.
Frequently Asked Questions
What does the GSC Performance report show?
The GSC Performance report shows four metrics — clicks, impressions, CTR, and average position — for every query and page your site has data for in Google Search. It can be filtered by query, page, country, device, and search appearance. It is the only source for actual impression and click data from Google; third-party tools estimate these numbers.
How often should I check the GSC Performance report?
Weekly for click-level monitoring — check for sudden drops using the 7-day vs previous 7-day comparison. Monthly for deeper analysis — use the 3-month vs previous 3-month comparison to detect content decay, ranking trends, and CTR changes. Set up Looker Studio alerts to flag significant weekly drops automatically.
Why is my average position misleading?
Average position in GSC is a mean across all impressions for a query — blending mobile, desktop, different countries, and different times of day. A page that ranks #1 for desktop and #15 for mobile shows as position 8 in aggregate. Always filter by device and country before making ranking decisions based on average position.
How do I export GSC data beyond the 1,000-row limit?
The Performance report UI shows a maximum of 1,000 rows. To export complete data, use the Search Console API or connect GSC to BigQuery via the API for automated daily exports. Looker Studio also bypasses the row limit when connected via the API rather than the native connector. For most teams, the BigQuery export is the recommended method for retaining and analyzing full GSC datasets.
What is the branded queries filter in GSC?
Launched in November 2025, the native branded queries filter separates branded traffic (queries containing your brand name) from non-branded traffic directly inside the Performance report — without regex filters or external tools. Non-branded GSC data reflects actual SEO performance; branded traffic reflects brand awareness. Filtering non-branded traffic is now the correct baseline for measuring organic search performance.

