
Introduction
Most SEO teams spend their budget chasing new keywords while ignoring the growth sitting inside their own Google Search Console account. The data is already there: pages that Google is showing thousands of times a month, but barely anyone clicks. Rankings hovering at position 8 or 12 — close enough to matter, too far to convert. Content that ranked six months ago and is quietly bleeding impressions with no alert fired. These aren’t edge cases. They’re the norm for sites that treat GSC as a reporting tool rather than an opportunity engine. This guide is built for SEOs who are past the basics. You’ll get a prioritized, repeatable framework for surfacing the highest-leverage GSC opportunities — so you stop leaving traffic on the table that Google has already handed you.Key Takeaways
- Pages ranking positions 5–15 are your highest-ROI optimization targets — one title/meta tweak can jump them to page one.
- Impressions without clicks signal a metadata problem, not a content gap — fix the headline before adding more words.
- Queries with zero clicks are content briefs hiding in plain sight — they confirm demand before you write a single word.
- GSC’s coverage report regularly reveals indexation drops that silently tank pages without a ranking alert.
- A recurring weekly audit (filter → export → score → act) compounds faster than any one-time optimization sprint.
What "GSC Opportunities" Actually Means (And Why Most SEOs Miss Them)?
Most SEO teams open Google Search Console when something breaks — a traffic drop, a coverage error, a ranking collapse. That’s the wrong mental model, and it’s costing them growth they already earned.
GSC opportunities aren’t buried features or hidden reports. There are gaps between what Google is already doing for your site and what you’re actually capturing from it. The signal is sitting right there in your Performance report. The problem is that most teams never look past the surface numbers.
Here’s the core distinction that separates teams that grow from GSC from teams that just report to it.
- Reporters open GSC to confirm what they already know: clicks are up, positions improved, traffic looks fine. They treat it as a dashboard.
- Operators open GSC to find leverage — pages that are one title tag away from doubling their CTR, queries generating 4,000 impressions a month that nobody is explicitly targeting, URLs with crawl anomalies silently bleeding their rankings.
The missed opportunities almost always fall into five buckets:
- Pages already visible to thousands of searchers but generating almost no clicks (CTR problem, not a content problem)
- Keywords ranking at positions 8–14 that are statistically one step from page-one traffic (a quick-win you can action this week)
- Queries with high impressions and zero clicks — a content gap confirmed by real search demand
- Pages whose rankings have been sliding for 90 days that no alert has flagged (quiet decay)
- High-value pages with almost no internal links pointing at them (PageRank being left on the table)
The Data Interpretation Problem Nobody Talks About
GSC averages hide reality. When GSC shows your page at “average position 6.4,” that number is a mathematical mean across every query variation, every device, every geography, every date in the range. Your page might rank position 2 for branded variations of the query (inflating the average upward) and position 14 for the high-volume head term you actually care about — hidden inside that same average.
The fix: stop reading average position at the page level. Click into each page and look at query-level position data. A page that looks comfortably at position 6 often has its most valuable keyword sitting at position 13 — invisible at the surface level.
The Segmentation Layer Most Teams Skip
GSC defaults to showing aggregate performance across all devices and all countries. This is where opportunity disappears into noise. A page might have strong desktop rankings but be performing terribly on mobile — and since mobile now accounts for the majority of Google searches, the aggregate hides a serious problem. Filter your Performance report by device (mobile vs. desktop) separately and compare. A page with average position 5 on desktop and position 18 on mobile isn’t a position-5 page — it’s a mobile optimization problem disguised as a decent ranking.
Same principle applies to geography. If you’re a UK business and your top pages rank well in the US but poorly in the UK, the aggregate looks fine while your actual target market is underserved. Segment first, then conclude.
The reason most SEOs miss these: most teams treat GSC as a health check tool — something to open when traffic drops — leaving most of the value unused. The fix isn’t a new tool or a bigger budget. It’s changing what questions you bring to the data.
The Striking Distance Method: Targeting Positions 5–15 for Fast Wins
Striking distance keywords are those that rank just outside the top positions — typically positions 5–15 — and present opportunities for optimization to push them into higher rankings. The reason they matter more than any other segment is simple: the effort-to-reward ratio is completely asymmetric. You’re not starting from scratch. Google already trusts your page enough to show it. You’re not building a new asset — you’re maximizing one you already have.
How to Find Them in GSC?
- Open the Performance report → Search Results
- Set the date range to the last 3 months (enough data to smooth out volatility)
- Enable both Average Position and Impressions columns
- Filter by position: set a range of greater than 4, less than 16
- Sort by Impressions descending
Before identifying opportunities, it’s critical to understand how to read the GSC Performance report within Google Search Console — especially how position data behaves when filtered for striking distance queries.
What you’re looking for: keywords with the highest impression count sitting in that position band. These represent your fastest wins because the pages are already close to page one.
Where Most SEOs Stop — And What to Do Instead?
They find the keyword, then add it to a backlog. The actual optimization is the part that moves rankings:
- Expand thin sections. Add a dedicated section with 200–400 words of relevant, helpful content using the target keyword naturally in the heading and body text.
- Add missing subtopics. Compare your page to the top 3 results. A missing FAQ, a comparison table, a definition block — these are what separate position 9 from position 3.
- Build internal links with exact-match anchor text. A page already ranking at position 11 can often be nudged to page one purely through internal link equity, without touching the content at all.
Prioritization rule: Target keywords in positions 11–15 first, as they require less effort to move to page one. For seasonal terms, prioritize those approaching their peak search period for immediate impact.
The Keyword Cannibalization Check
Before spending time optimizing a striking distance page, confirm that only one URL is ranking for that keyword. GSC will sometimes show the same query appearing across two different pages in your Performance report. This is cannibalization — two of your own pages competing against each other, splitting authority and suppressing both.
Filter your Performance report by a striking distance keyword, then check the Pages tab. If two URLs appear for the same query, consolidate the content into the stronger URL and redirect the weaker one — or apply a canonical tag — then optimize.
The Seasonal Timing Multiplier
Most teams apply the striking distance method evenly across the calendar year. This is a missed leverage point. A page ranking position 12 in October that you optimize in November will benefit from year-end demand surges in Q4. Ranking movement that would normally take 6 weeks can produce outsized traffic gains if it coincides with a seasonal demand peak.
Cross-reference your striking distance list against Google Trends for each keyword. Pages where the query’s seasonal peak is 4–8 weeks away should jump to the front of the optimization queue — even above seasonally flat, higher-impression pages.
One thing third-party tools will never show you that GSC will: a page targeting one primary keyword might also rank for unexpected long-tail variations — queries the tool doesn’t track. Check the full query list for each striking distance page before deciding what to optimize.
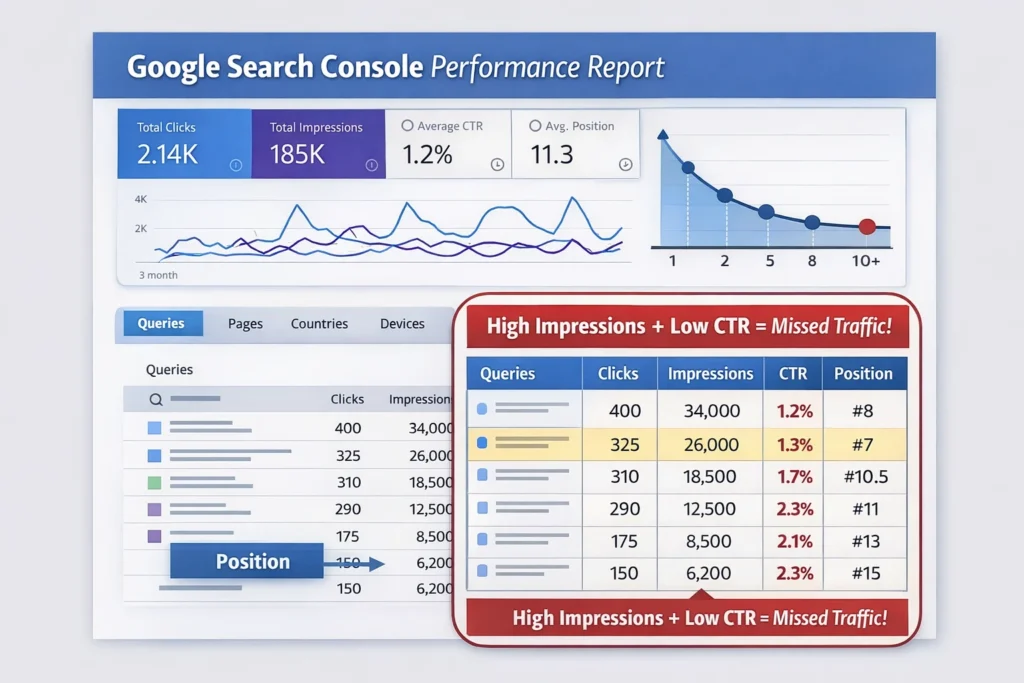
High Impressions, Low Clicks: Fixing Your CTR Leaks
If a page is generating thousands of impressions but barely any clicks, the problem is rarely the content. It’s the packaging. Google decided the page was relevant enough to show — users decided it wasn’t worth clicking. That gap lives in your title tag and meta description.
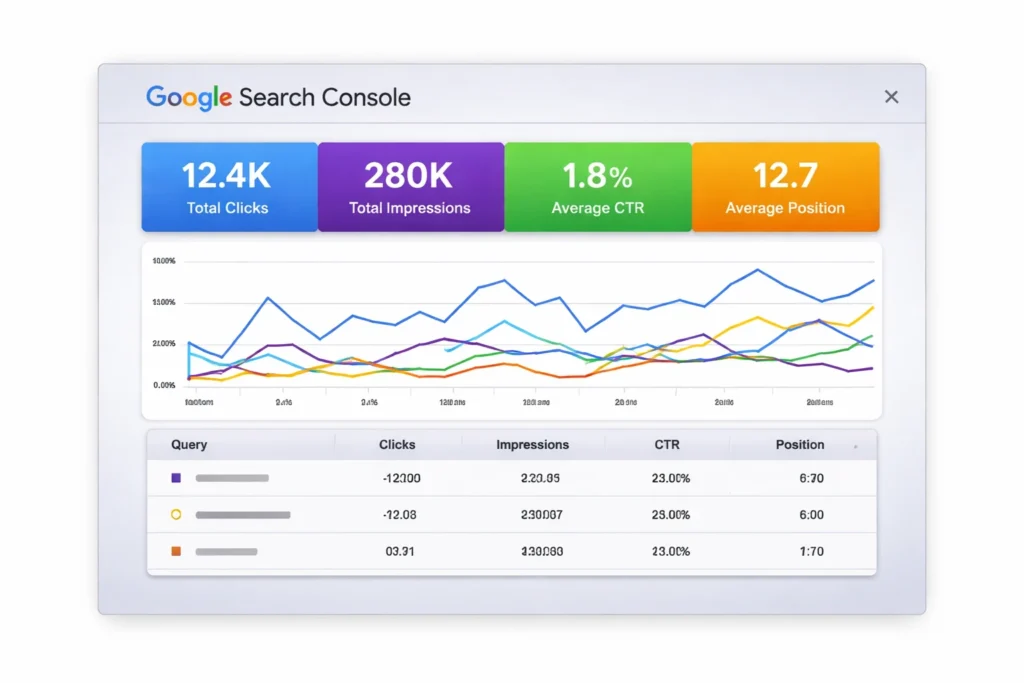
How to Surface These Pages in GSC?
- Go to Performance → Search Results
- Enable CTR as a column
- Click into the Pages tab
- Sort by Impressions descending
- Look for pages where CTR is below 2–3% in the top 20 positions
A 2025 study across 200,000 keywords found that organic CTR for the top position dropped from 28% in 2024 to 19% in 2025 — a 32% decline attributed largely to AI Overviews pushing traditional results further down the page. Some CTR drops are structural (AI is eating the clicks before they reach you), and some are fixable (your title is weak). Knowing the difference saves you from optimizing the wrong thing.
The SERP Feature Audit — Your CTR Benchmark Is Wrong
Every SEO benchmark for expected CTR by position assumes a standard blue-link SERP. In 2025, that assumption is broken for most queries. Expected CTR at position 3 on a query with a featured snippet, an AI Overview, a People Also Ask block, and a video carousel is categorically different from position 3 on a clean SERP.
Before diagnosing a CTR problem, identify what SERP features are present for each high-impression query. Google the query in an incognito window and count how many SERP features appear above position 1. Each one displaces organic results. If your page at position 4 is actually the 9th visible element on the page, a 1.2% CTR isn’t underperformance — it’s what the SERP structure produces.
What will fix it: structured data to compete for the featured snippet, FAQ schema to appear in People Also Ask, and content formatted as direct answers to trigger AI Overview citations.
Diagnosing the Cause
- Position 1–3, low CTR: Likely an AI Overview or featured snippet absorbing clicks. Fix: optimize to be the snippet, not just rank below it.
- Position 5–10, low CTR: This is a title/description problem. Users are choosing a competitor’s result over yours.
What to Fix, Specifically?
Rewrite title tags — add power words like “Essential,” “Ultimate,” or “Proven,” or the current year. Include your target keyword near the beginning and keep the title under 60 characters so it doesn’t get truncated in search results. Add clear benefits to meta descriptions.
The more surgical fix is intent mirroring — look at the actual query generating impressions and ask: does my title answer the question the searcher is asking, or does it just describe what the page is about? There’s a big difference between “Our Guide to Email Marketing” (describes content) and “How to Write Email Campaigns That Actually Get Opened” (answers the question). The second one gets clicks.
The Emotional vs. Functional Title Test
Most CTR advice focuses on functional optimization — keyword placement, character length, power words. What separates genuinely high-performing titles is emotional specificity:
- “How to Reduce Customer Churn Rate” — functional, describes the content
- “Why Your Best Customers Leave — And the 3 Fixes That Actually Work” — emotionally specific, names the fear and promises resolution
Click-through isn’t a technical decision for users; it’s an emotional one made in under two seconds. Test this by writing three title variations for your lowest-CTR pages — one functional, one curiosity-driven, one outcome-focused — and use GSC’s before/after comparison after 28 days.
One thing most articles miss: flat or declining clicks alongside growing impressions is not always a CTR problem. Check whether the high-impression queries are now triggering AI Overview panels. If they are, the fix is optimizing your content structure to be cited inside the overview, not just outranking it.
The fastest, most underrated CTR fix that takes 20 minutes: open your top 20 high-impression, low-CTR pages, Google each primary query yourself, and read your own title as a searcher. Most of the time, you’ll immediately see why someone would scroll past it.
Zero-Click Queries: Turning Dead Impressions into Traffic
Zero-click queries are the ones where your page appears in Google — sometimes thousands of times a month — but receives exactly zero clicks. Most SEOs glance at these and move on. They shouldn’t. These queries are the closest thing to a guaranteed content brief you’ll ever get.
How to Find Them?
What you now have is a list of search queries that real people are genuinely typing, that Google thinks your site is relevant enough to show, but that your current content isn’t actually satisfying — either because there’s no dedicated page for them, or because the content you have isn’t a strong enough match to earn the click.
- Go to Performance → Search Results
- Export the full query data (use the Export button, then open in Sheets)
- Filter for rows where Clicks = 0 and Impressions > 200
- Sort by Impressions descending
Three reasons a query might have zero clicks:
- Ranking page 2 or 3. Impressions are low but non-zero because some people click “more results.” Fix: treat these as striking distance opportunities.
- Google answers it directly. Definition queries, simple factual questions, and calculations. These are genuinely zero-click because the SERP itself is the answer. Don’t chase these.
- You have no content targeting this query. A page about email marketing tools is accidentally triggering for “how to write a cold email subject line,” but there’s no dedicated content for it. This is the opportunity.
The Query Clustering Method for Content Architecture
Most guides tell you to turn zero-click queries into content. They don’t tell you how to group them — and ungrouped, they produce a fragmented content strategy with dozens of thin, standalone pieces that each barely rank.
Export your full zero-click query list and cluster semantically related queries together. Queries like “how to write a cold email,” “cold email subject line examples,” and “cold email follow-up sequence” aren’t three separate content briefs — they’re sections of one comprehensive guide. A single well-structured page targeting all three as H2s will outrank three thin individual posts because it satisfies more of the search demand landscape in one place.
Simple rule: if two zero-click queries would make sense as adjacent sections in the same article, they belong on the same page. If they represent entirely different intents (informational vs. transactional), they’re separate pages.
The Brand Query Zero-Click Trap
One zero-click segment that deserves its own treatment: branded queries with zero clicks. If your brand name plus a modifier — “YourBrand pricing,” “YourBrand reviews,” “YourBrand vs. Competitor” — is generating impressions with zero clicks, this isn’t a standard content gap. It’s a conversion funnel leak.
These queries come from people who already know you exist and are actively evaluating you. Build dedicated comparison and review landing pages targeting these branded modifiers explicitly. A “YourBrand vs. Competitor X” page that ranks above third-party review sites (G2, Capterra, Trustpilot) for that query is worth more than most blog posts on your site.
The content brief template hidden in zero-click data: take your top 10 zero-click, question-based queries and treat each as an H2 for an existing page, or as a new standalone piece. You’ve already confirmed demand exists. You didn’t have to guess.
Content Decay Detection: Which Pages Are Quietly Losing Ground
Content decay is the slow traffic death that no alert fires for. A page that ranked position 3 last spring is now at position 7. Clicks dropped 40%. Nobody noticed because it happened over 90 days, not overnight. By the time it shows up in a quarterly review, it’s already cost you thousands of visits.
GSC doesn’t have a “decay dashboard.” But it does give you everything you need to build one. But it does give you everything you need to build one. Once decay is identified, a structured approach to how to refresh content using GSC ensures you recover rankings systematically instead of making reactive updates.
The Detection Workflow
- Go to Performance → Search Results
- Set the date to Last 16 months (max GSC allows)
- Click Compare → select two equal periods (e.g., last 6 months vs. prior 6 months)
- Click into the Pages tab.
- Sort by Clicks difference (ascending) — pages with the biggest click decline float to the top
These are your decay candidates. Now filter out pages where the decline is explained by seasonality — a holiday gift guide losing clicks in February is not decaying, it’s seasonal. What you’re hunting for is pages on evergreen topics whose clicks are down 20%+ with no seasonal explanation.
In many cases, declining impressions are the earliest SEO growth warning — understanding how to increase impressions in SEO helps identify visibility loss before traffic decline becomes severe.
How to Diagnose Each Decay Candidate?
- Check position trend: Is the ranking slipping, or is position stable but CTR dropped? Position slipping = competitors updated their content and passed you. Position stable, CTR dropping = AI Overviews absorbing clicks, or your title became stale.
- Check the SERP yourself: Are there new SERP features? Did a major competitor publish a definitive guide that’s now dominating? Has the search intent shifted?
The Intent Drift Diagnosis
The most underdiagnosed cause of content decay isn’t competitor content improvements — it’s intent drift. Google’s understanding of what a query means evolves, and pages built for the old intent get left behind even when the content itself is still accurate and well-written.
A query like “CRM software” that used to return informational overview articles now returns comparison pages and product listings — because Google has learned that most people typing that query are ready to evaluate options. To diagnose: Google your decaying page’s primary keyword and compare current SERP results to what your page was originally built for. If the top results are now a different format, the fix isn’t refreshing your content — it’s restructuring it to match the new dominant format the SERP rewards.
| Pattern | Signal | Fix |
|---|---|---|
| Position 3 → 8 over 6 months | Competitors refreshed, outranked you | Update content, add depth, rebuild internal links |
| Impressions stable, clicks down 30% | AI Overview eating clicks | Optimize for snippet inclusion; add FAQ schema |
| Both impressions and clicks down | True ranking drop or intent shift | Full content audit + possible consolidation |
| Zero impressions for formerly ranking page | Indexation issue | URL Inspection tool, then Coverage report |
The Refresh Prioritization Matrix
Not all decaying pages deserve the same refresh investment. Score each decay candidate against two axes: Traffic potential versus Refresh effort.
- High potential + low effort = immediate priority. Full rewrite, publish this week.
- High potential + high effort = scheduled priority. Allocate a content sprint.
- Low potential + low effort = quick pass. Update the date, fix broken links, done.
- Low potential + high effort = deprioritize or consolidate into a stronger page.
Build this as a quarterly process, not a one-off. Set a recurring export at 90-day intervals, compare against the prior period, and flag anything with a >20% click decline. The pages you catch early cost a refresh. The ones you miss for 12 months often need rebuilding from scratch.
Internal Linking Gaps GSC Reveals That Third-Party Tools Miss
Third-party crawl tools like Screaming Frog and Ahrefs are excellent for mapping what internal links exist. GSC tells you something those tools can’t: which pages need internal links based on their actual search performance, and which pages have the authority to pass it.
This distinction is what makes GSC-driven internal linking more effective than link audits alone. You’re not just finding orphaned pages — you’re building a performance-based case for where to send link equity.
What the GSC Links Report Actually Shows You?
Navigate to Links at the bottom of the left sidebar in GSC. The Internal Links section shows you two things: which pages receive the most internal links across your site, and which pages receive the fewest.
The problem: the most-linked pages are often your homepage, about page, and a few old blog posts — not your revenue-generating content or your striking distance opportunities. This is the gap.
The Authority Flow Mismatch Problem
GSC’s Links report will often reveal something counterintuitive: your most internally-linked pages aren’t your best-performing pages. They’re your oldest pages — content published when your site was smaller, before your revenue pages existed. Internal link authority accumulates on old content by default, not by strategy.
Run this check: compare your top 10 most internally-linked pages (from GSC Links report) against your top 10 pages by organic revenue or conversion value (from GA4). If the lists don’t substantially overlap, you have an authority flow mismatch — PageRank is pooling on pages that don’t generate business value, while your money pages are starved of internal equity.
The fix isn’t just adding links to money pages. It’s auditing your most-linked old pages and updating their internal links to point toward your current revenue-driving and striking distance content. You’re redirecting an existing stream, not digging a new channel.
The Cross-Reference Method
- From GSC Performance: export all pages ranked positions 5–20 with 500+ monthly impressions
- From GSC Links: export all pages sorted by internal link count (ascending)
Now cross-reference. Any page that appears on both lists — ranking in striking distance and receiving almost no internal links — is your highest-priority internal linking target. A page with 5,000 monthly impressions at position 12 and only 2 internal links pointing to it is a priority fix you can action today.
What third-party tools miss: External crawlers can tell you a page has 2 internal links. GSC tells you that page is generating 5,000 monthly impressions. Only the combination of both data points reveals the urgency of the fix.
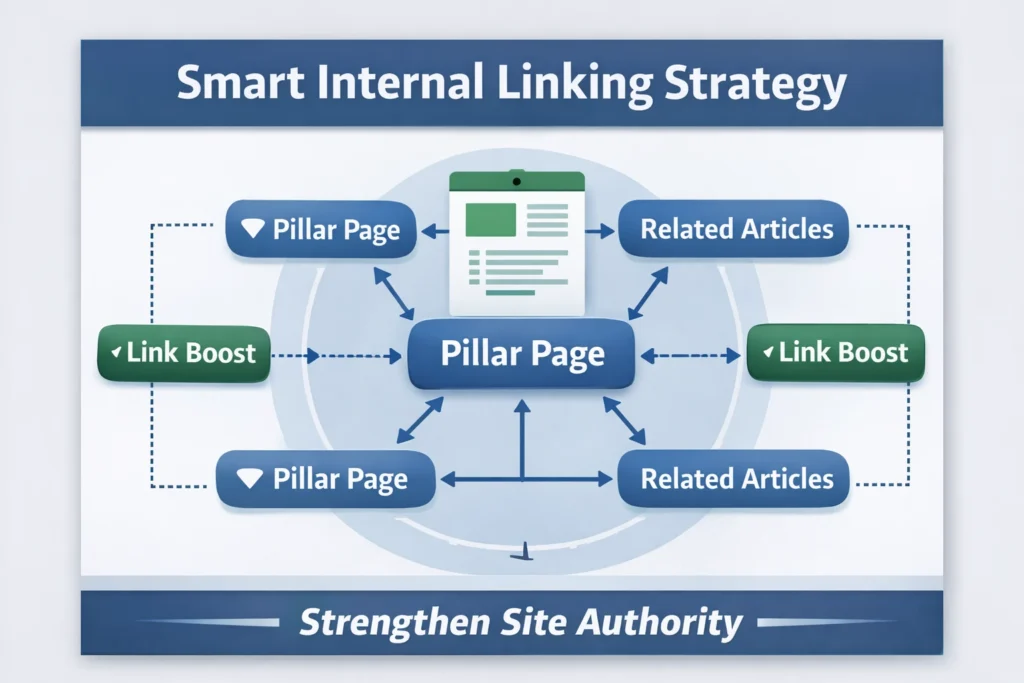
The Hub and Spoke Validation
Content teams often build hub-and-spoke architectures in theory, but never validate whether the internal linking reflects the intended structure. For each pillar/hub page on your site, check its GSC internal link count, then check each spoke page’s. If your hub page has fewer internal links pointing to it than some of its spoke pages, the architecture is inverted — Google is receiving mixed signals about which page is authoritative for the topic cluster.
Anchor Text Quality Check and Quick Win Protocol
While in the Links report, look at the anchor text your top-linked internal pages are receiving. If your top anchor text is still “learn more” or “click here,” swap those for keyword-rich, descriptive text that reflects what the destination page is actually about.
Building a Weekly GSC Opportunity Audit (Repeatable System)
The difference between a team that treats GSC as a reporting tool and one that treats it as a growth engine is the process. One-off audits produce one-off results. A weekly rhythm compounds over time. Here’s a repeatable, lightweight audit that takes 30–45 minutes once you’ve run it a few times.
Block 1: Position Monitor (10 min)
Pull the Performance report filtered to the last 28 days. Compare against the prior 28 days. Focus on two signals:
- Pages that dropped 3+ positions — flag them for a content review within the next 2 weeks.
- Pages that gained 3+ positions and are now in the 5–15 range — flag them for a metadata and content optimization sprint.
Don’t touch every fluctuation. Focus on movement that crosses a threshold — entering or exiting page one, entering striking distance for the first time.
Block 2: CTR Leak Scan (10 min)
Filter Performance by the last 28 days. Go to the Pages tab. Sort by Impressions descending. Identify the top 10 pages where CTR is below 2% and average position is 1–15.
For each, ask: Is this a structural issue (AI Overview) or a title issue? If the AI Overview, check whether the page could be cited inside the overview by improving its structured data and answer-style content. Aim to fix 2–3 of these per week.
Block 3: Zero-Click Query Harvest (10 min)
Export this week’s query data to Sheets. Filter for Clicks = 0, Impressions > 100. Scan for question-based queries (anything starting with who, what, how, why, when, best, vs, or review). Add the best 3 to your content backlog with the impression count as the priority signal. Do this consistently, and your content calendar will always be populated with demand-validated topics — no keyword tool required.
Block 4: Coverage Check (5 min)
Open the Index → Pages report. Look for any increases in the “Not indexed” category. Common culprits: newly published pages that weren’t submitted, redirect chains that broke, or “discovered but not indexed” creeping up. For any newly appearing issues, run the URL Inspection tool and request indexing. Wait 7–10 days, re-inspect the URL, and check for crawl blocks in robots.txt or noindex tags if still unindexed.
Block 5: Query Shift Monitor (5 min)
In the Performance report, filter by date (last 28 days), click the Queries tab, sort by Impressions, then filter by “Compare” against the prior period. Look for queries with zero impressions in the prior period and meaningful impressions in the current one. These are organic rankings you didn’t earn intentionally — Google matched your page to a query you never optimized for. A single H2 addition and a meta description tweak can turn a position-18 accidental ranking into a position-6 intentional one within weeks.
The Scoring System
| Criteria | Points |
|---|---|
| Current impressions > 1,000/month | +2 |
| Position 5–15 (striking distance) | +2 |
| CTR below 2% at position 1–10 | +2 |
| Page has fewer than 5 internal links | +1 |
| Competitor content on same query is old (2+ years) | +1 |
- 5+ points = immediate priority
- 3–4 points = queue-worthy
- Under 3 = deprioritize
The Compounding Documentation Habit
The teams that extract the most long-term value from weekly GSC audits aren’t the ones with the best spreadsheets — they’re the ones who document what they did and what happened afterward. Log every optimization action with four fields: URL, change made, date of change, and position/CTR before the change.
Four weeks later, return to each logged action and record the after metrics. This creates a site-specific evidence base for which tactics actually work on your domain. After 6 months of this, your GSC workflow will be calibrated in a way no external playbook can replicate.
When the Weekly Audit Should Pause?
Don’t run your standard audit in the 2–3 weeks following a Google core update. Data during and immediately after a core update is volatile — positions fluctuate, impressions spike and crash, and CTR patterns are unreliable. Acting on that data produces optimizations based on noise, not signal.
During a core update window, shift your audit to monitoring only: track which pages gained and which lost, but make no optimization changes. Wait for rankings to stabilize (typically 2–3 weeks post-update), then run your standard audit on the settled data.
Conclusion
Google Search Console is the most underused growth tool in most SEO stacks — not because it lacks data, but because most teams ask the wrong questions when they open it. If you’re new to the tool, start with our Google Search Console Guide before continuing — this guide assumes you’re already inside the Performance report.
The framework in this guide flips that default. Instead of treating GSC as a reporting dashboard, you’re treating it as a revenue recovery system. The striking distance method surfaces your fastest wins. The CTR leak scan shows you where packaging is costing you clicks. Zero-click query harvesting gives you a content backlog validated by real demand. Decay detection catches silent ranking slides before they become expensive rebuilds. Internal link cross-referencing turns existing page authority into measurable ranking improvements.
None of this requires a bigger budget, a new tool, or more content. It requires a different habit: opening GSC weekly with a structured set of questions, scoring what you find, acting on the highest-leverage opportunities, and documenting what happens.
Start with one block this week. Run the striking distance filter, find your top 3 positions 5–15 pages, and rewrite the title tags. Then check back in 28 days. That’s the compounding cycle that separates the teams who grow from the ones who just report.
Frequently Asked Questions
What are hidden SEO growth pages?
Hidden SEO growth pages are existing pages on your website that already receive impressions in Google Search Console but generate little to no clicks or conversions. They rank in positions 5–20, have high impression volume, and need targeted optimization — not new content — to unlock significant traffic gains.
How do I find hidden growth pages in Google Search Console?
Open GSC’s Performance report, enable the Impressions and Average Position columns, then filter for positions 5–20 over a 90-day window. Sort by impressions descending. Pages with high impressions, low CTR, and rankings in the 5–15 range are your hidden growth pages — already visible to Google, underperforming for users.
Why do high-impression pages get low clicks?
High impressions with low clicks typically indicate a metadata problem, not a content problem. Google has validated your page’s relevance, but the title tag or meta description isn’t compelling enough to earn the click. Secondary causes include AI Overviews absorbing clicks above your result and misalignment between your title and the searcher’s actual intent.
How long does it take to see results after optimizing a hidden growth page?
Most hidden growth page optimizations — title tag updates, content depth improvements, and internal link additions — produce measurable ranking and CTR changes within 2–6 weeks. Pages in striking distance (positions 5–15) tend to respond faster than pages ranked lower because Google’s trust signal is already established.
What's the difference between content decay and a hidden growth page?
A hidden growth page has stable or growing impressions but is underperforming due to weak metadata or thin content — it has untapped potential. A decaying page is actively losing impressions and rankings over time due to fresher competitor content or an intent shift. Both live in GSC’s Performance report, but they require different fixes: optimization versus refresh.